Track goals on a dashboard
Opening metrics one at a time makes it hard to tell whether you are getting closer to a goal. Gather your goal metrics on a dashboard and see on one screen what beat its target this week and what fell behind. First create metrics and add values in Goals and metrics.
Create a dashboard
Section titled “Create a dashboard”- Under BI › Dashboards in the sidebar, click New dashboard.
- Start from scratch with Blank dashboard, or start from a ready-made layout with Create from template.
- Click Edit to add sections and widgets, and pick the metric each widget shows.
Read target lines and the Goals strip
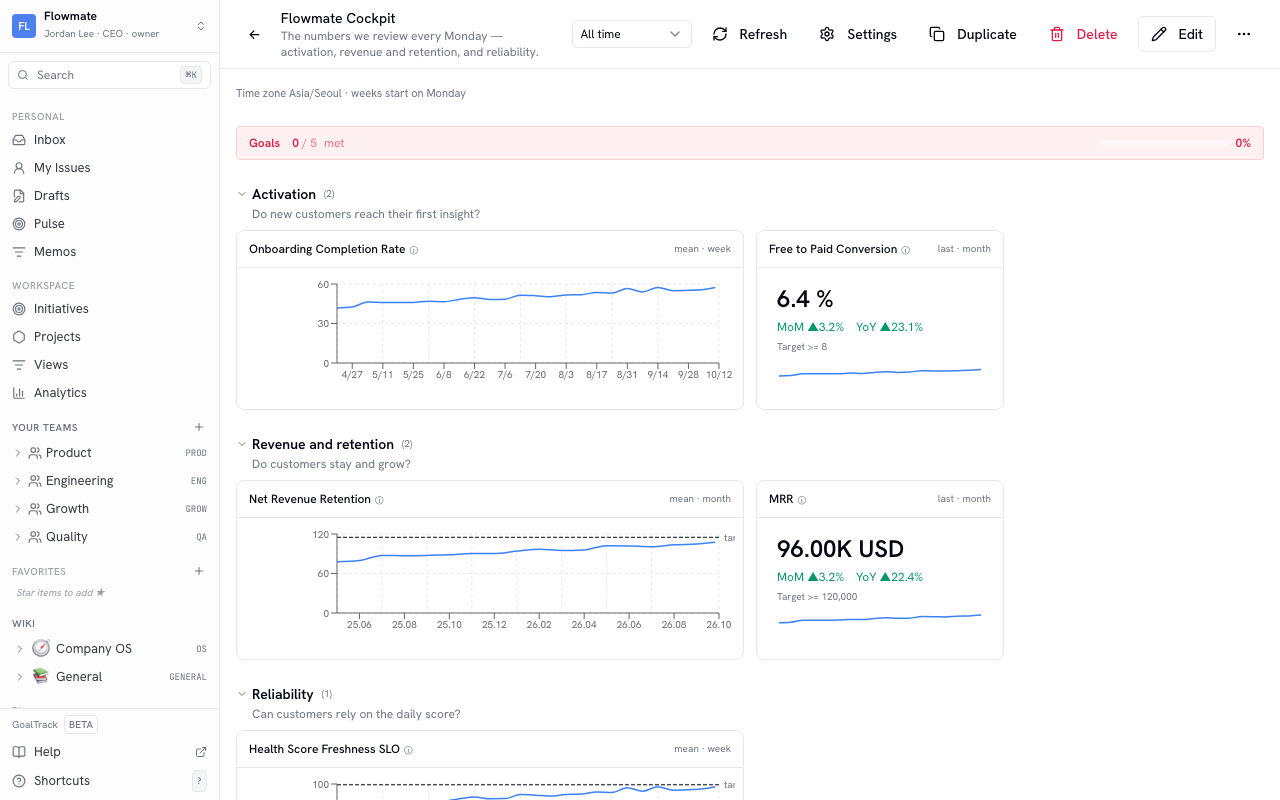
Section titled “Read target lines and the Goals strip”- When a metric has a target value, its widget chart draws the target line too. Whether you are above or below the line is the answer for that goal.
- The Goals strip at the top of the dashboard counts the widgets with a target whose latest value meets it, shown as “N / M met”.
- Change the time range at the top to see the last few weeks or months. Refresh recalculates the widget numbers.
When values are late
Section titled “When values are late”When a metric that gets values automatically has had no new value for a while, its widget shows “No new value for N days — last value …”. That tells you whether a flat chart means “nothing changed” or “no values arrived”. Check the script or CI schedule that sends values, and reconnect it with the samples under Send values automatically on the metric’s page.
Read it alongside your initiatives
Section titled “Read it alongside your initiatives”- Link the same metric to an initiative’s Goal metrics with Link BI metric, and the value you see on the dashboard becomes that initiative’s current value. The initiative and the dashboard show the same number.
- Numbers that come straight from issues, such as throughput and time to complete, are in Workspace › Analytics in the sidebar, with nothing to set up.